
Written by Ravindu
26 Oct 2025
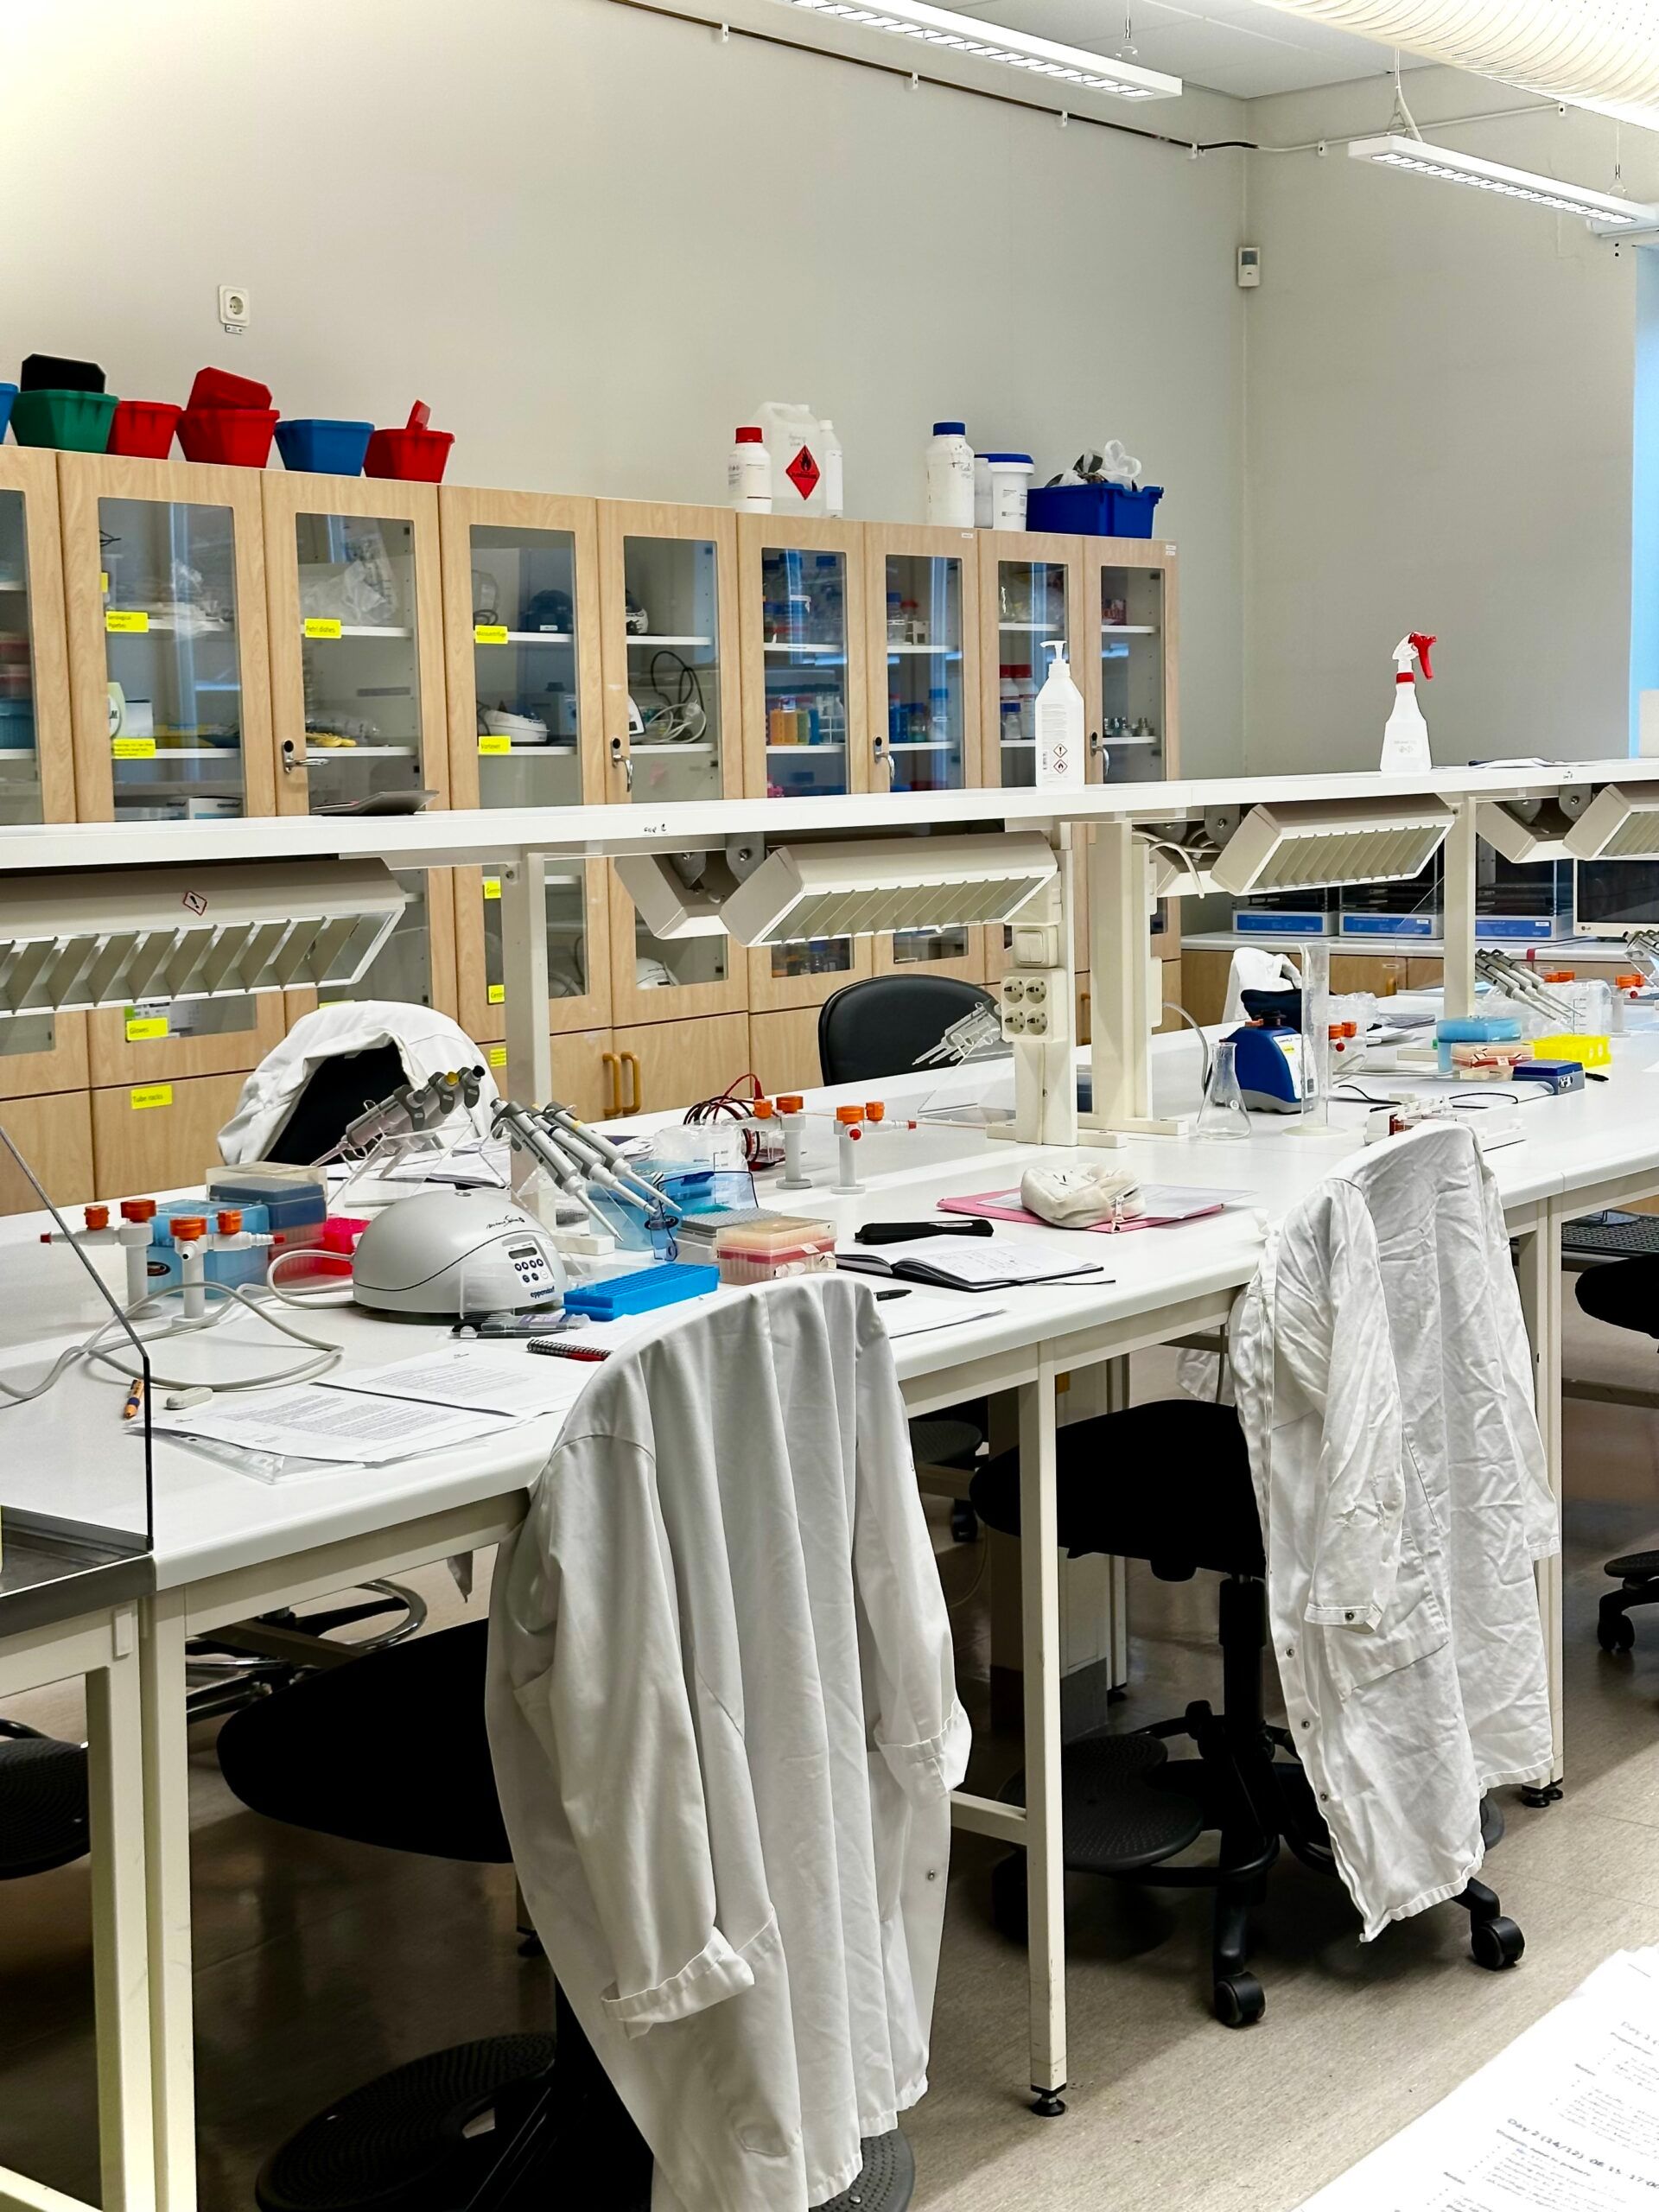


Last week I published a blog post on what it’s like to have a full week of laboratories as a bachelor’s student here in Sweden. We took a gene from a firefly and inserted it into a bacteria to make it glow! But that was just one half of my academic life so far this semester. My program, being a fusion between Molecular Biology and Computer Science, also has a fun statistical course going parallel. And the best part? We get to design our own mini research project… and then present it in front of the class.
At first, I wanted to go for something completely out of the box. Being a big fan of horror films and thrillers, I thought it would be cool to measure how people’s bodies react to a spooky short-film. Like tracking heart rates before and after a scary scene! But, that idea came with a few problems. I’d have to make people watch horror films (which isn’t exactly kind if they hate the genre) and measure their heart rates before and after, which is logistically and ethically tricky. So I opted out for a different experiment: one that wouldn’t put others through a rough time, but me myself… Excessive running! ✨🫠

The Aim of The Project
Ever since I moved to Sweden, I’ve noticed something fascinating. People here love running. Even in the freezing cold, when there’s snow everywhere, you’ll see runners powering through like it’s no big deal. I thought that was so cool, and honestly, kind of inspiring. So I decided to make my experiment a little tribute to this Swedish fitness culture.
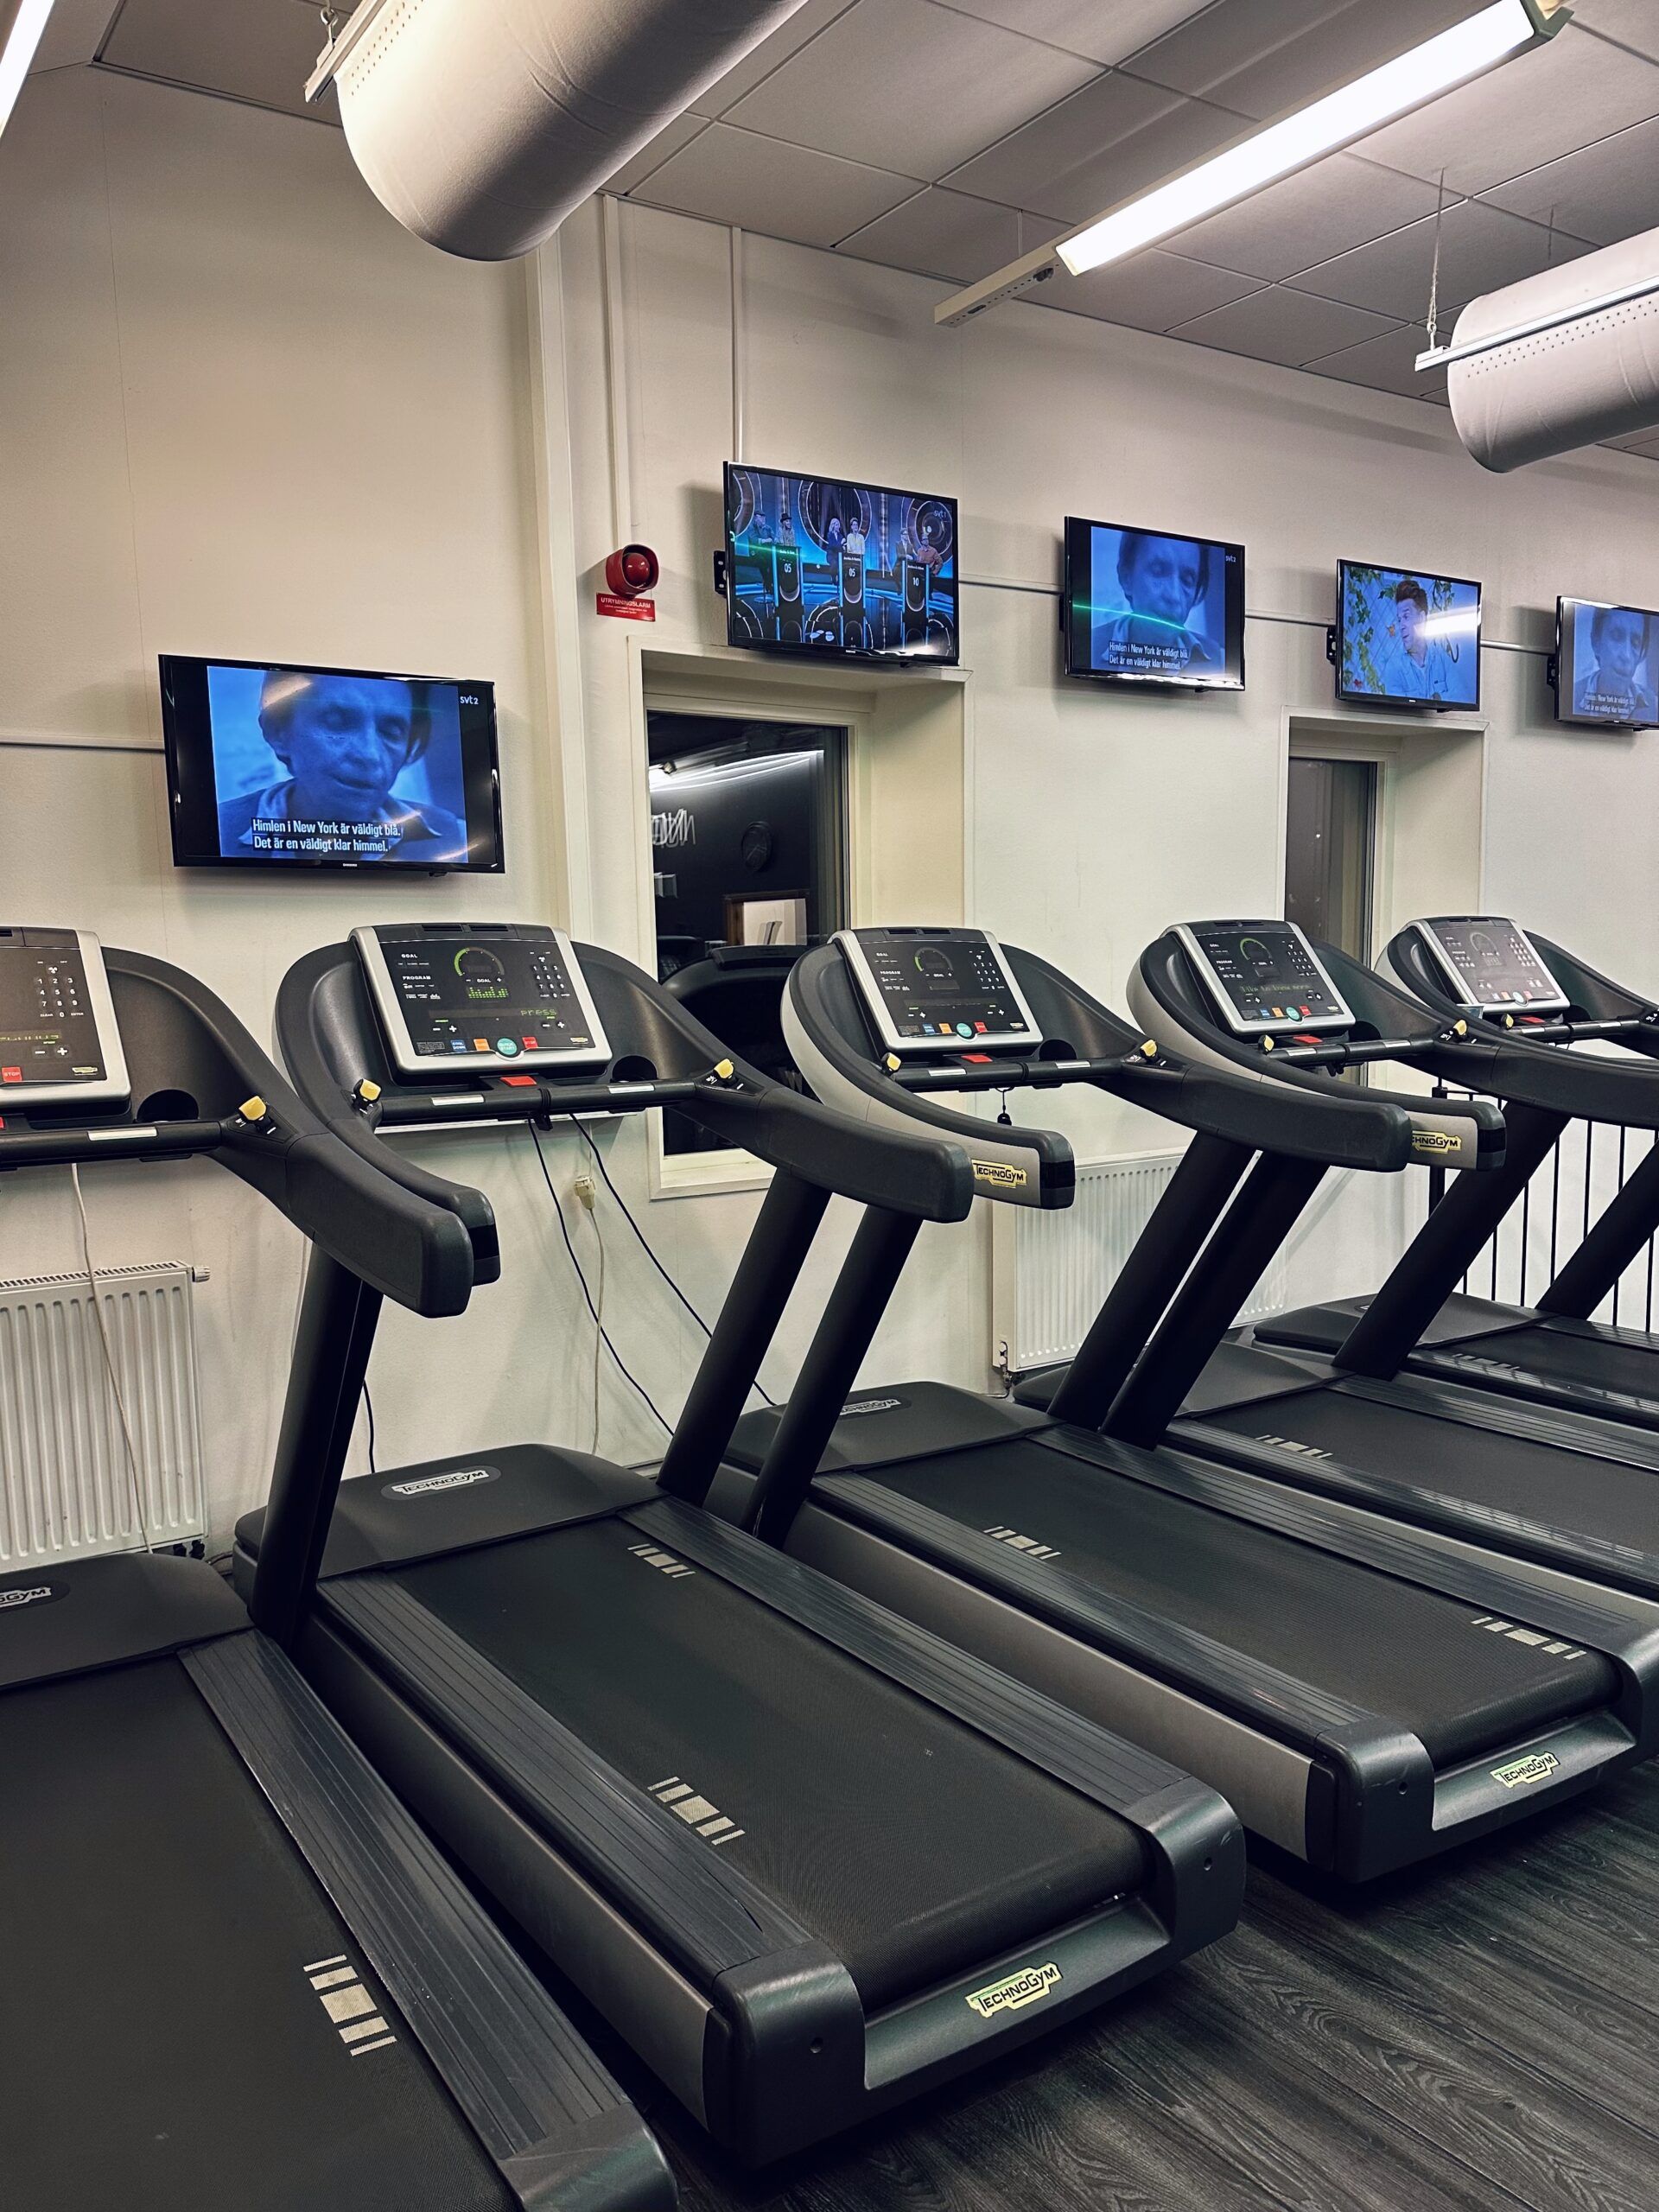
Running outdoors, however, wasn’t ideal for data consistency. The weather changes, roads can get slippery, and I wasn’t about to risk my life for science. So I took my experiment indoors to the gym treadmill.
The goal was simple: to see if running duration affected heart rate. First, I wanted to check if there were significant differences between sessions. Then, I wanted to see if there was a clear relationship between how long I ran and how my heart rate responded.
The Project Itself
And that’s how I ended up running 21 sessions in one week, yes, twenty-one, and draining the life out of myself. Okay, maybe I’m exaggerating a bit. It was actually kind of fun!
So I ran on the treadmill at 10 km/h for sessions lasting from 1 to 7 minutes. I then repeated each session three times, so I could get an average value (very important in statistics). After each run, I measured my heart rate using my trusty old smartwatch, noted it down on my phone, and later transferred everything into an Excel sheet on my laptop.
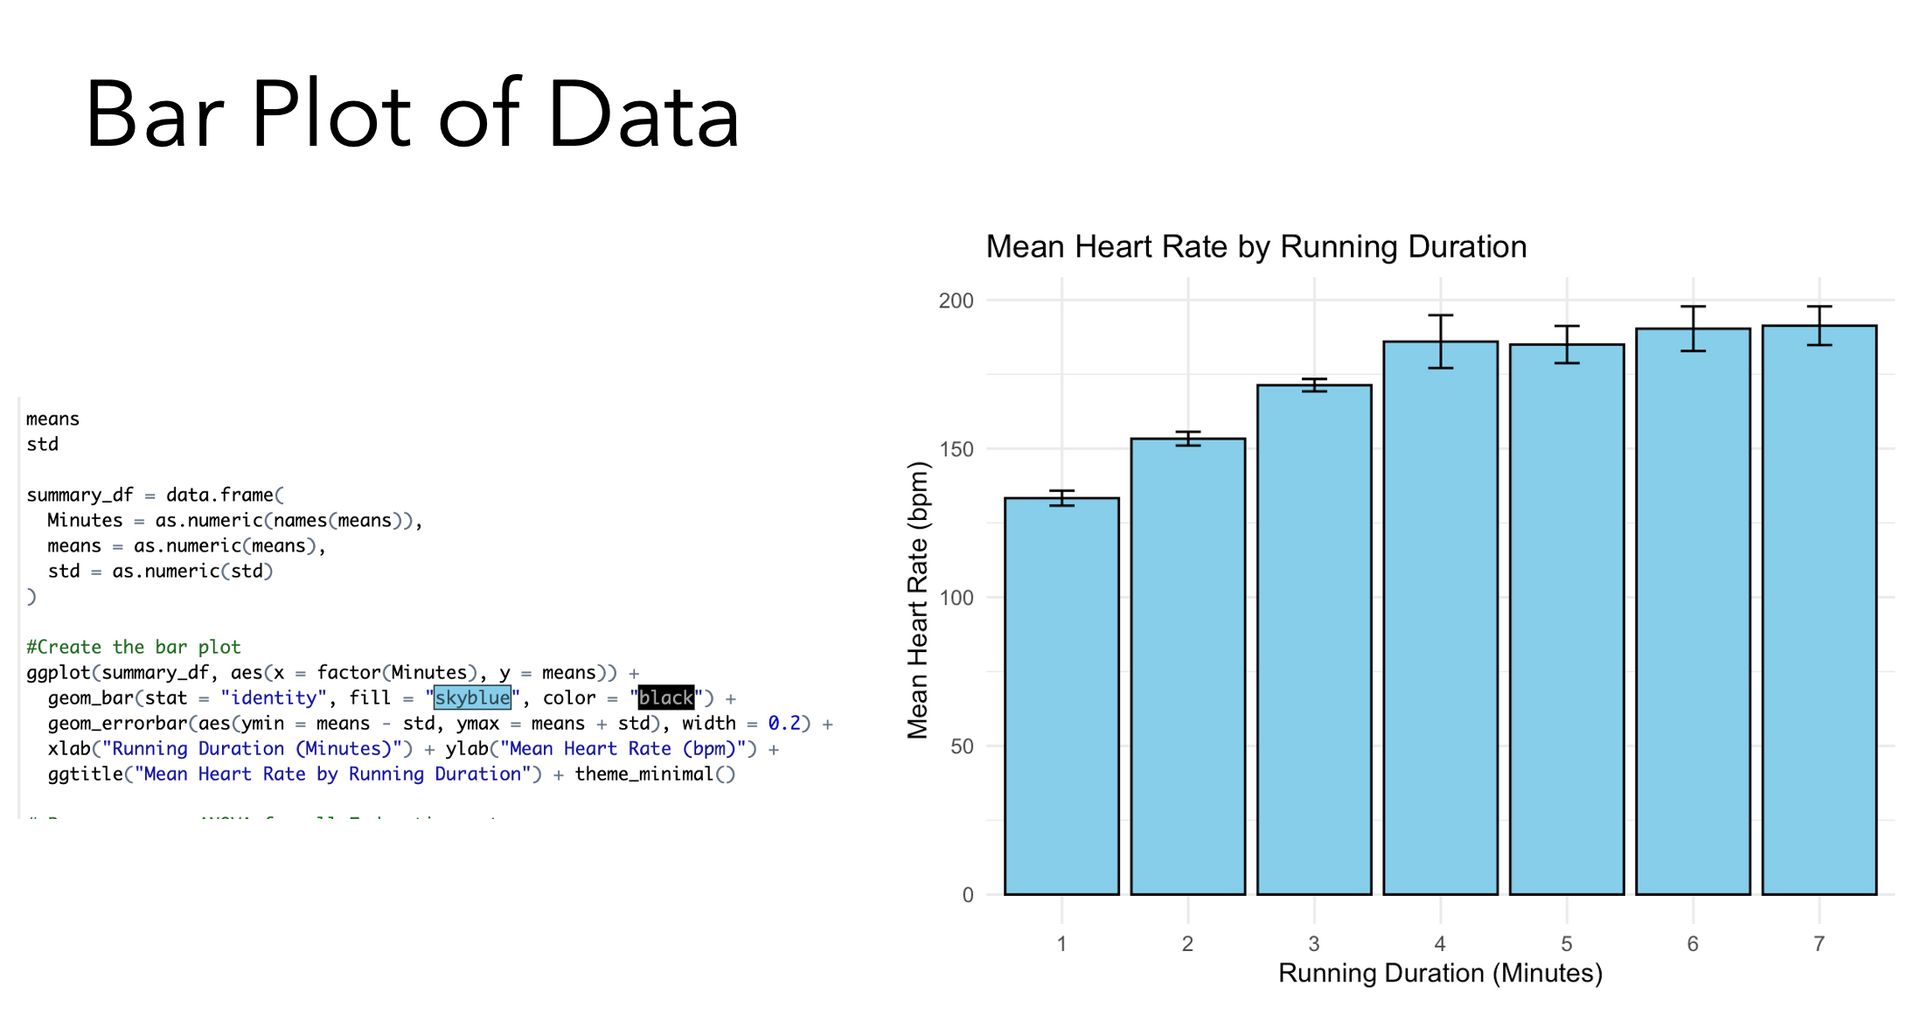
By the end of the week, I had all the data I needed. Then came the fun part, analyzing it. Using R, the programming language we’re learning in our course, I plotted graphs, ran statistical tests, and nerded out together with my friend ChatGPT for a while…

The Results
Now this might be a bit boring for those of you who aren’t really into statistics, but for the nerds out here (hey baddies, I see you ✊), the tests I used were the Pearson’s correlation test and the Annova test.
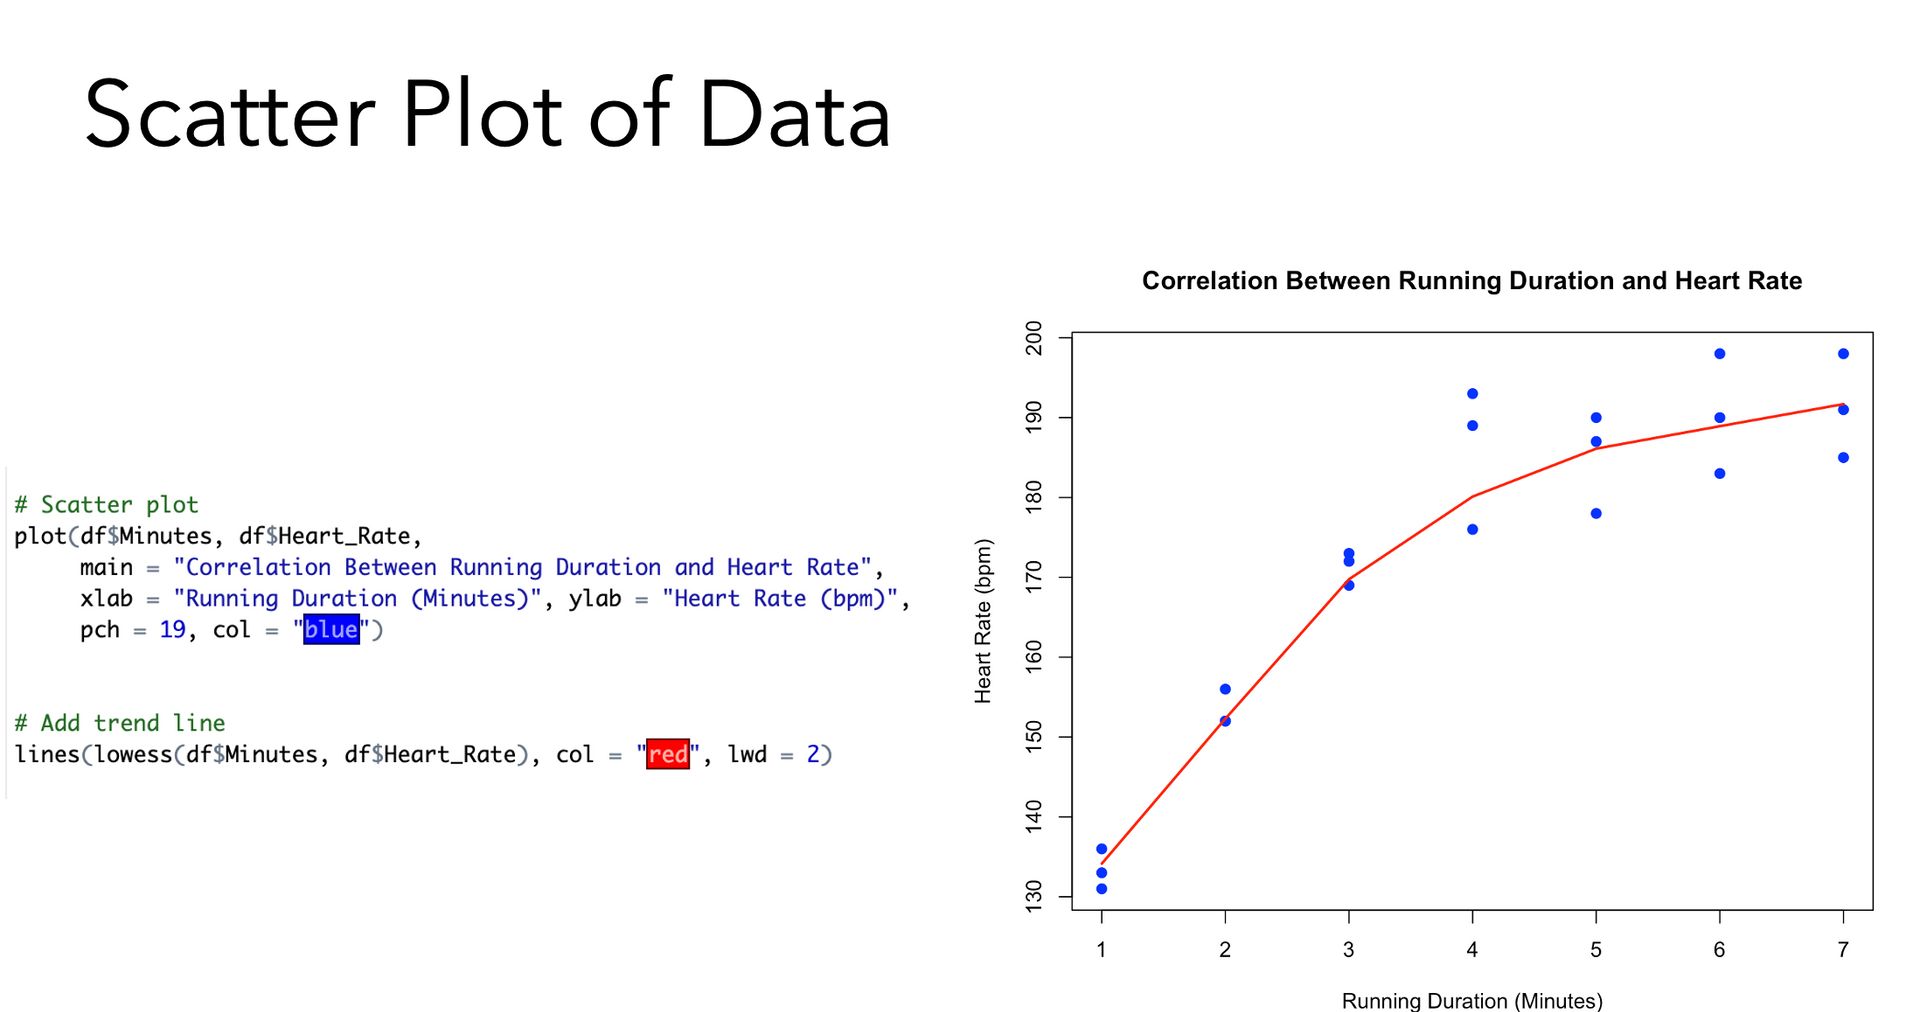
The results from the Annova test showed significant differences between sessions, and the Pearson’s test showed that there was a clear correlation between running duration and heart rate. In short, the longer I ran, the higher my heart rate went. Who would’ve guessed, right? But now, at least, it’s statistically proven! Go me!
Feedback From My Professor
Presenting the results to my class was one of the best parts. My professor appreciated the creativity and effort behind the topic and even suggested that I could take it further, maybe even build a mathematical model to predict how running time affects heart rate. I thought it was such a cool idea! Of course- heart rate doesn’t just plummet all the way to the 400 bpm, it reaches a constant after a certain point. Creating a model to predict that would be such a cool accomplishment. He said it could make a great thesis project someday!
Ways I Could Have Improved My Project
Of course, the experiment wasn’t perfect. For one, I only collected data from myself, which makes it quite personal and not exactly representative of the entire human race. It would’ve been much better to include several participants and compare averages.
Another improvement would’ve been to test longer running durations. I’m sure at some point, the heart rate stops rising indefinitely and reaches a plateau, but I didn’t push myself far enough to find out, and probably for the best.

Reflections on Swedish education and Presentations
I didn’t want to share this story just to talk about my experiment. I also wanted to highlight something I’ve noticed in Swedish education.
A friend of mine from Germany mentioned they rarely had to present anything during their bachelor’s, while in Sweden, almost every course includes a presentation or group project. It seems that compared to other European countries, there’s a much stronger focus here on projects, presentations, and practical learning. And I think that’s a great thing. It really helps you develop your communication skills, confidence, and creativity, all while learning the science itself.
All in all, this project turned out to be way more fun than I expected, and wasn’t just about numbers or graphs. I think that’s something I appreciate the most about studying here in Sweden. You’re encouraged to try weird ideas, be individual and creative, and actually enjoy the process.